The Musical Ear
The Musical Ear — Journal Français d'Oto-Rhino-Laryngologie (February 1953)
Communication by Alfred Tomatis presented to the 12th Congress of the Société Française de Phoniatrie (Paris, 15 October 1952) and published in the Journal Français d’Oto-Rhino-Laryngologie (no. 2, February 1953). On the basis of several hundred systematic audiometric examinations conducted on the workers and engineers of the test benches at the Arsenal de l’Aéronautique, Tomatis sets out the concept of the “musical ear”: 1 subject in 25, exposed to sonic environments of 120 to 140 dB, presents not an auditory dip at 4,000 Hz but a relative hyperacusis between 500 and 2,000 Hz forming an ascending curve from the low to the high frequencies — the signature of an “invulnerability to noise” which is found, identically, in professional musicians and singers.
The Musical Ear
by Mr Alfred Tomatis
Extract from the Journal Français d’Oto-Rhino-Laryngologie — Number 2, February 1953.
Communication presented to the 12th Congress of the Société Française de Phoniatrie — Paris, 15 October 1952.
Work carried out at the Research Laboratory of the Arsenal de l’Aéronautique.
I. — Invulnerability to noise
We thought it would be of interest to set out some of the observations gathered over the past three years, while carrying out systematic audiometric examinations on several hundred individuals — observations published elsewhere in the report on occupational deafness for the 1952 Congress of the Société Française d’O.R.L. All the subjects, engineers or workers, belonged to highly noisy industries, notably aviation factories, with their boilermaking workshops, their piston-engine test benches, and more particularly, with the present evolution of the field, their jet-engine test benches.
At the outset, we expected to find only deaf subjects, so impossible did it seem to us that an ear could survive in such fearful sonic environments, which can reach 120, 130 and even 140 dB. Very rapidly, however, we had to revise our opinion, so numerous were the auditions that had remained intact despite very prolonged periods spent under such conditions.
We thus concluded that the factor of individual susceptibility was indeed a significant element, conferring on a good number of individuals a kind of “invulnerability to noise”.
II. — The audiometric signature: 1 in 25
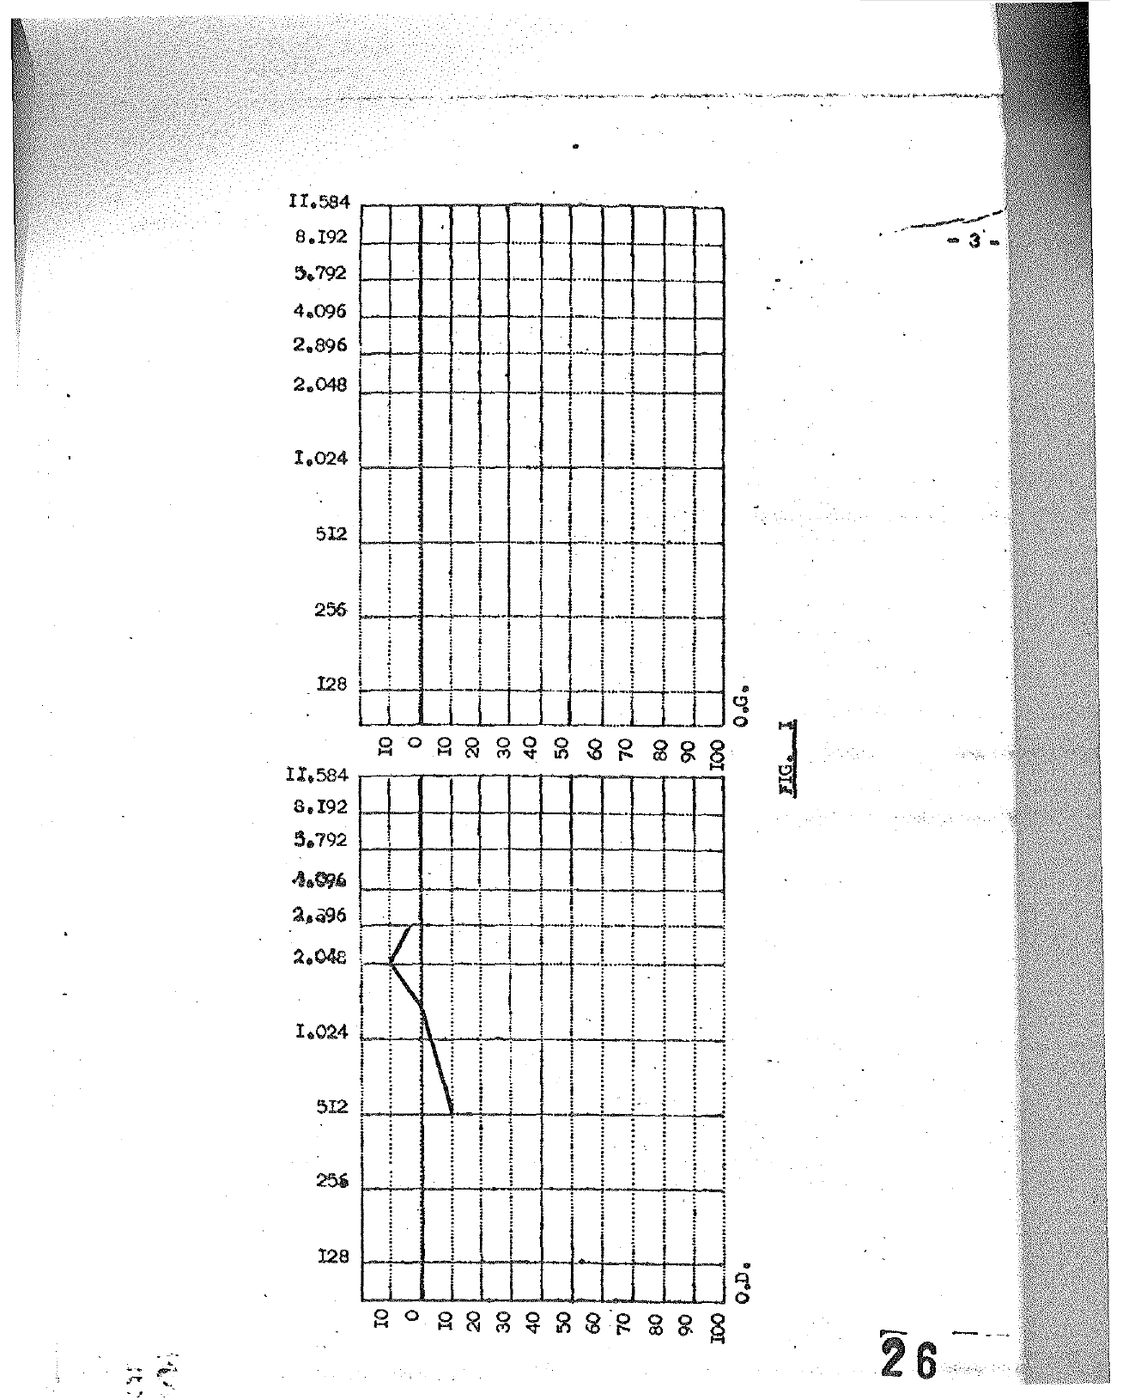
Moreover, among these particularly privileged subjects, some — and we have totalled about fifty out of some thirteen hundred, that is to say 1 in 25 — have an audiometric response curve which, far from drawing the classical dip at the level of 4,000 c/s or elsewhere, then towards the low frequencies, reveals a relative hyperacusis in a zone which, as a rule, extends between 500 c/s and 2,000 c/s, taking the form, as we have schematically represented it (Fig. 1), of an ascending curve from the low to the high frequencies, with a difference in level varying from 10 to 20 dB.
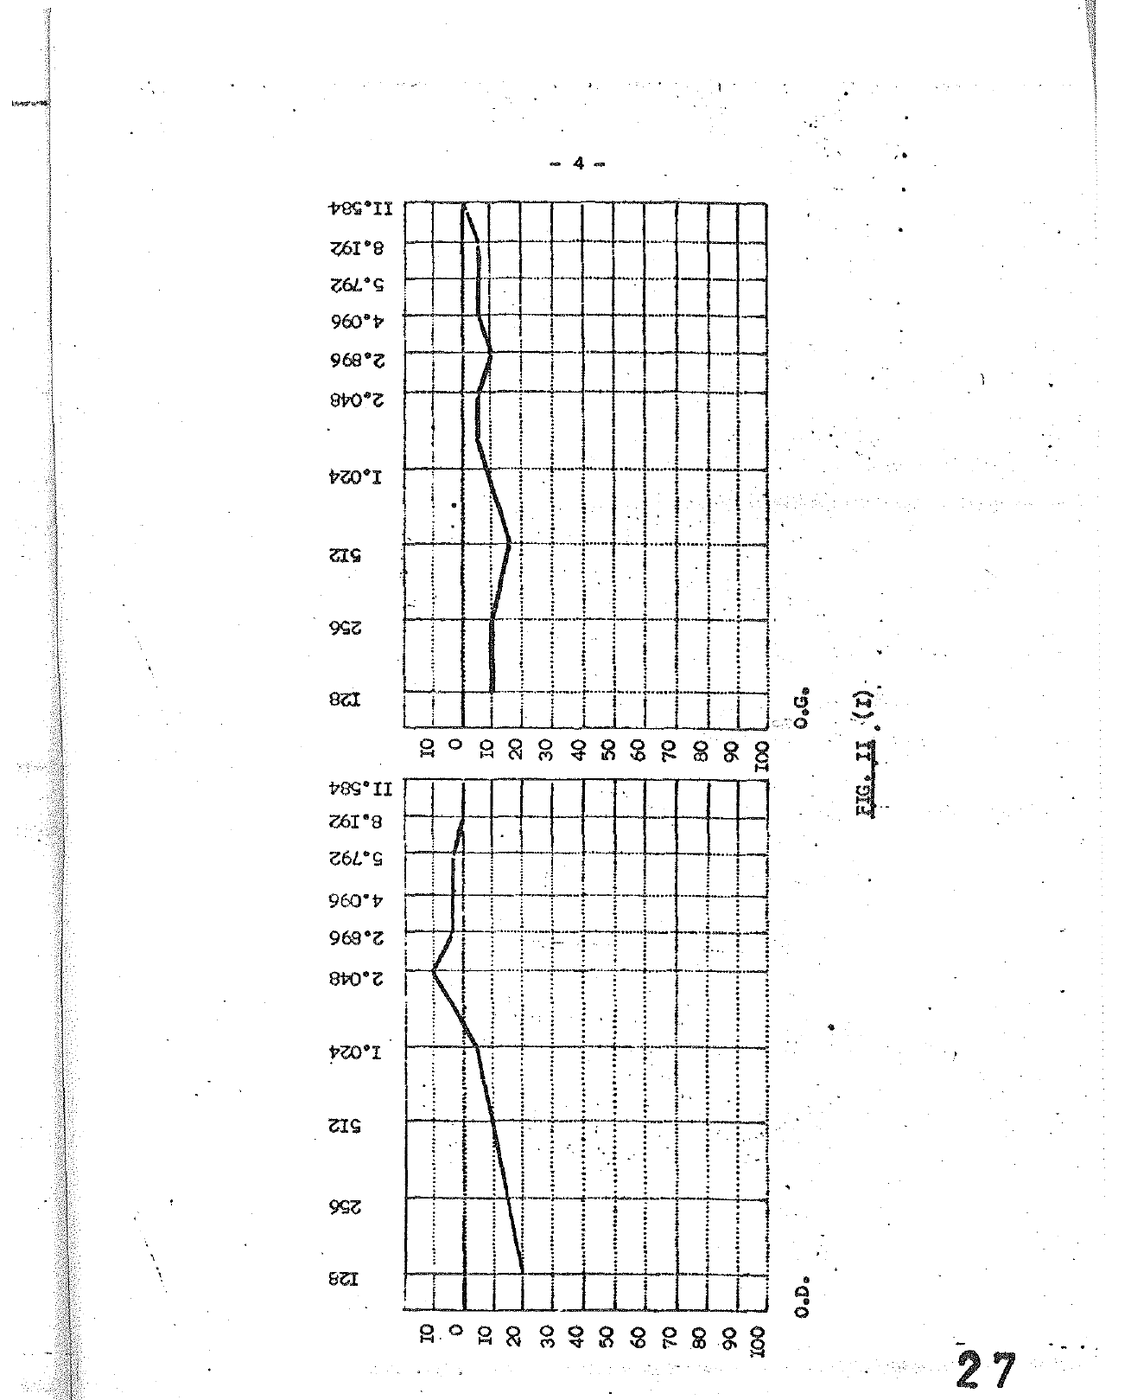
We here report selected examples: one on a worker exposed to noise for four years, the other on a subject exposed for 21 years. The same audiometric profile is noted on the right ear of each of these individuals in the 500 c/s — 2,000 c/s zone (Fig. 2).
III. — Singers who no longer sing in tune
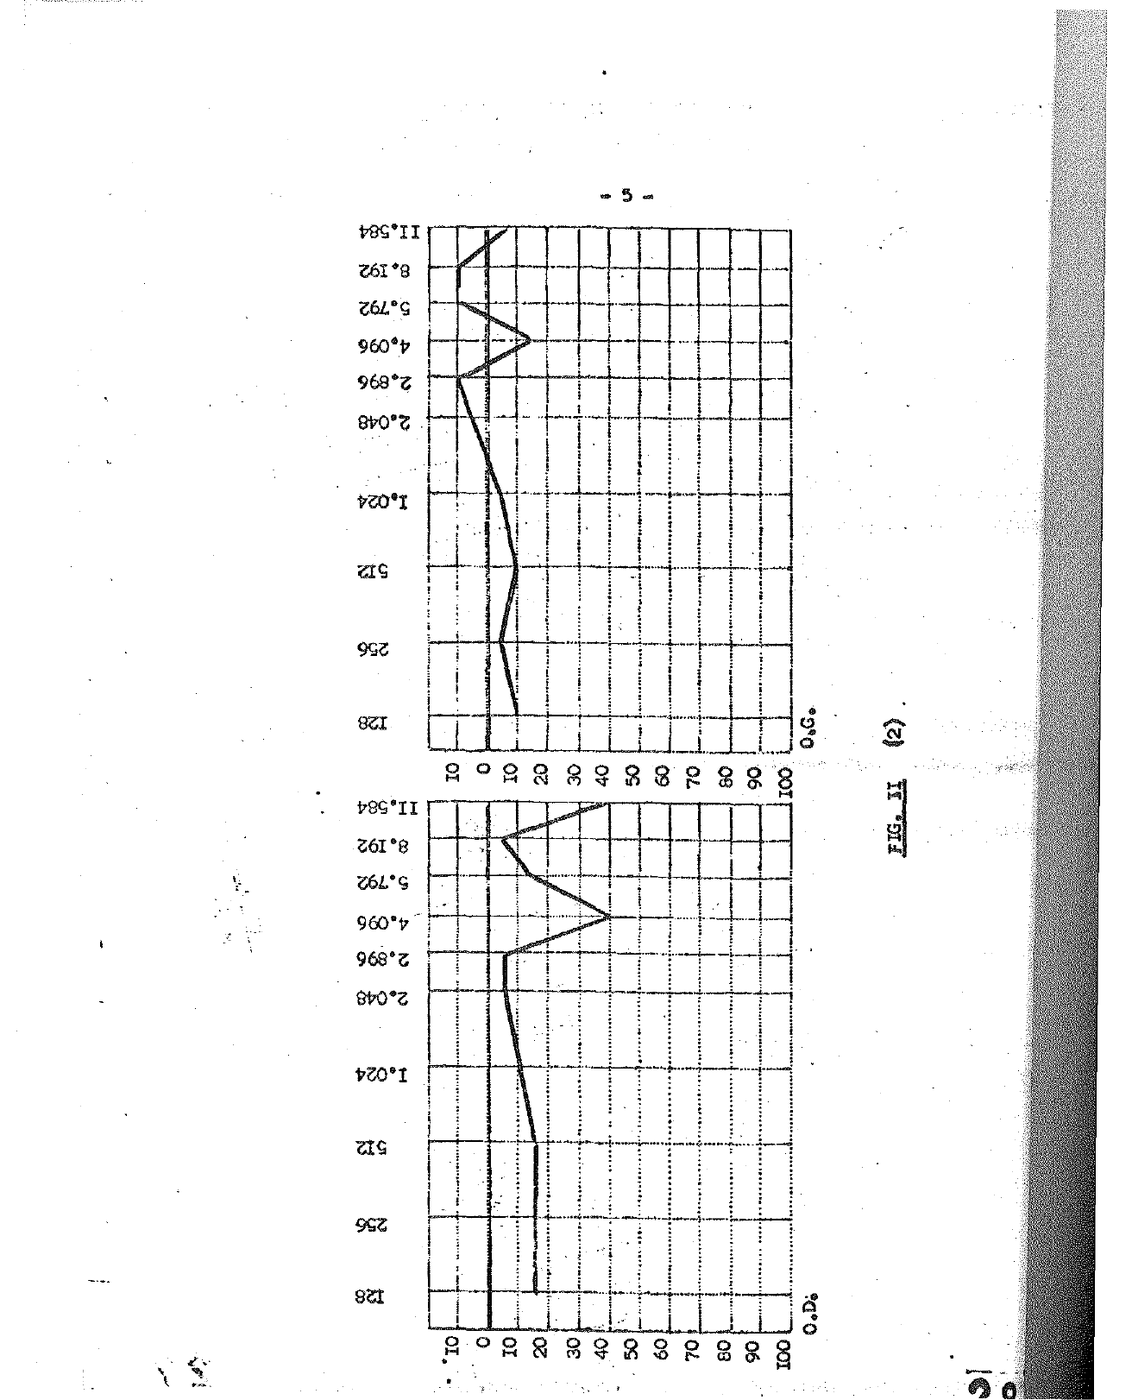
At about the same period, some two years ago, we had occasion to treat two singers, two professionals, whose principal — and least disabling — disorder lay in the impossibility of singing in tune: the first had long suffered from this; the second had been experiencing these troubles only for the past two or three days. Although neither acknowledged any apparent deafness, we nonetheless thought they presented a modification of their auditory acuity: this is what the following curves came to confirm (Fig. 3).
One cannot speak of hypoacusis, as may be seen, since the conversational zone was preserved; but a very rapid inflexion is noted at the level of 1,000 c/s, with a drop in the higher frequencies.
Our only concern was to raise their curve in the 2,000 c/s zone. We obtained this transiently for the first, permanently for the second. Thereupon, while the latter no longer sang out of tune, the first began to sing in tune or out of tune in accordance with the modifications — favourable or otherwise — of his hearing.
IV. — The meeting of the two observations
These latest audiometric curves struck us by their resemblance to those of the subjects invulnerable to noise. We therefore resumed our enquiry in the factory, and we had the surprise of finding that all the subjects without exception whose hearing answered to an audiometric tracing identical to the one we have just described (Fig. 1) were musicians, or friends of music: all had the musical ear in the broadest sense — that is to say, loved music, heard in tune, and above all (a fact we considered important for the phoniatrician and on which we shall insist more particularly) could reproduce a musical phrase accurately. So much so that, very quickly, on the sole sight of an audiogram, we could determine whether a given individual was a musician or not.
V. — Characteristics of the “musical ear” curve
The characteristic audiogram of the musical ear presents:
1°) The ascending curve from the low to the high frequencies described above (Fig. 1), with a difference in level of 10 to 20 dB between 500 and 2,000 c/s;
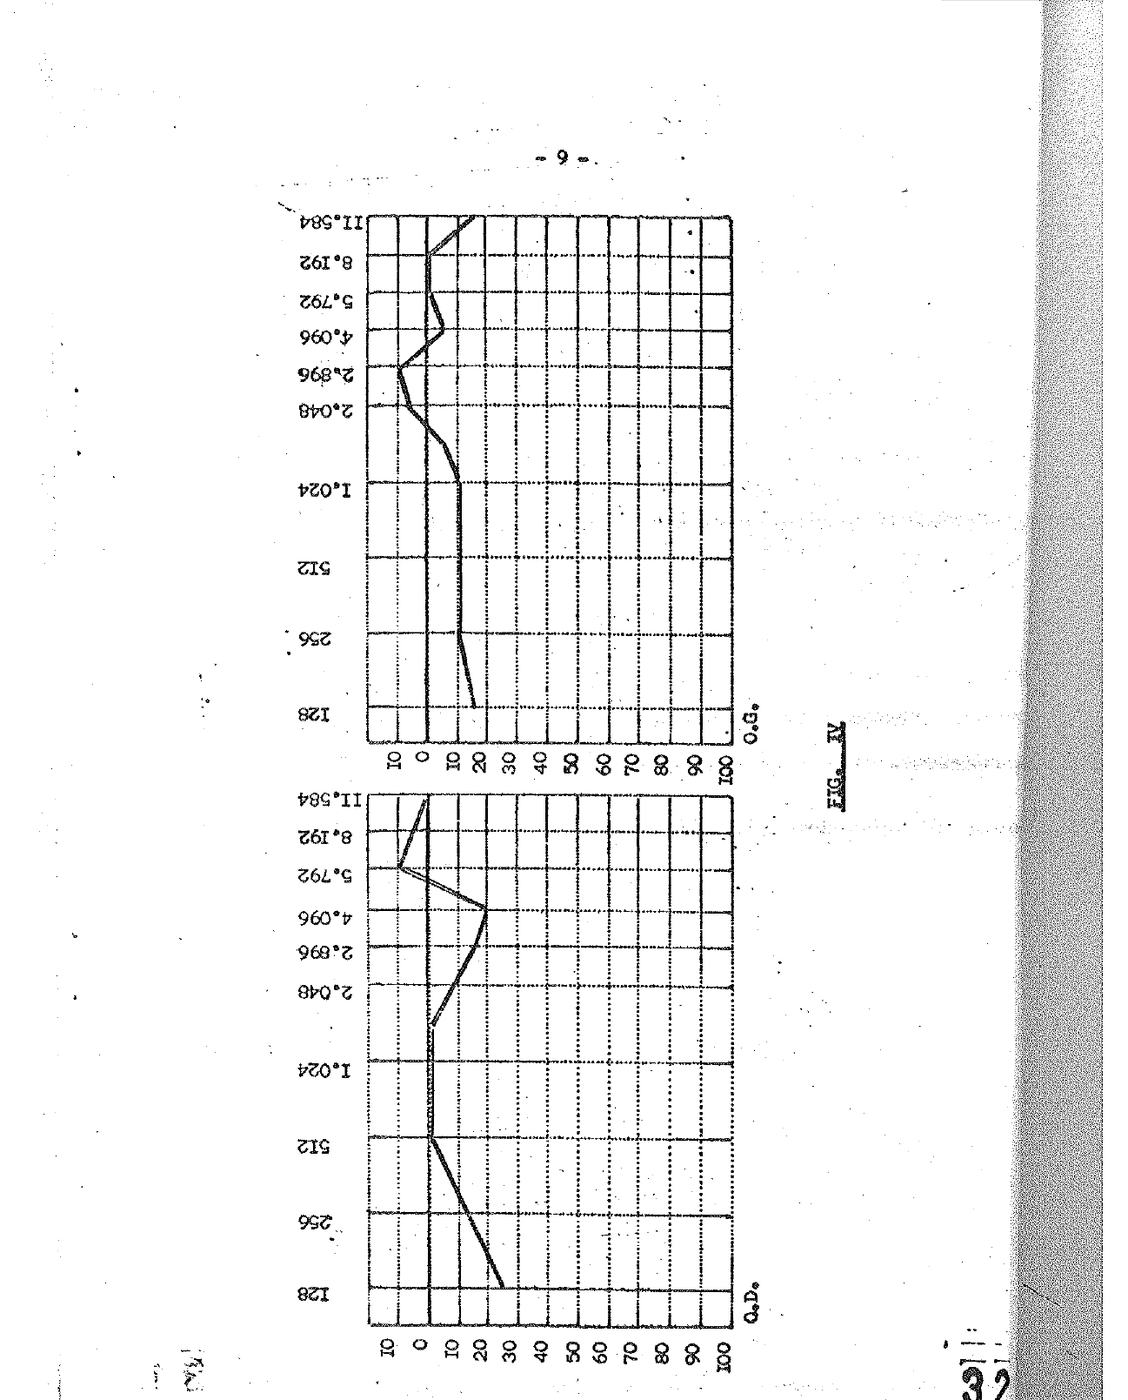
2°) The same configuration on both ears, with the remarkable exception of left-handed subjects, in whom auditory dominance is inverted (Fig. 4).
VI. — Clinical observations
3°) Audiogram of a woman, formerly a concert pianist, incapable of “going off-key”: her ear remains locked in the musical mode, to the point that she can no longer speak like everyone else (Fig. 5).
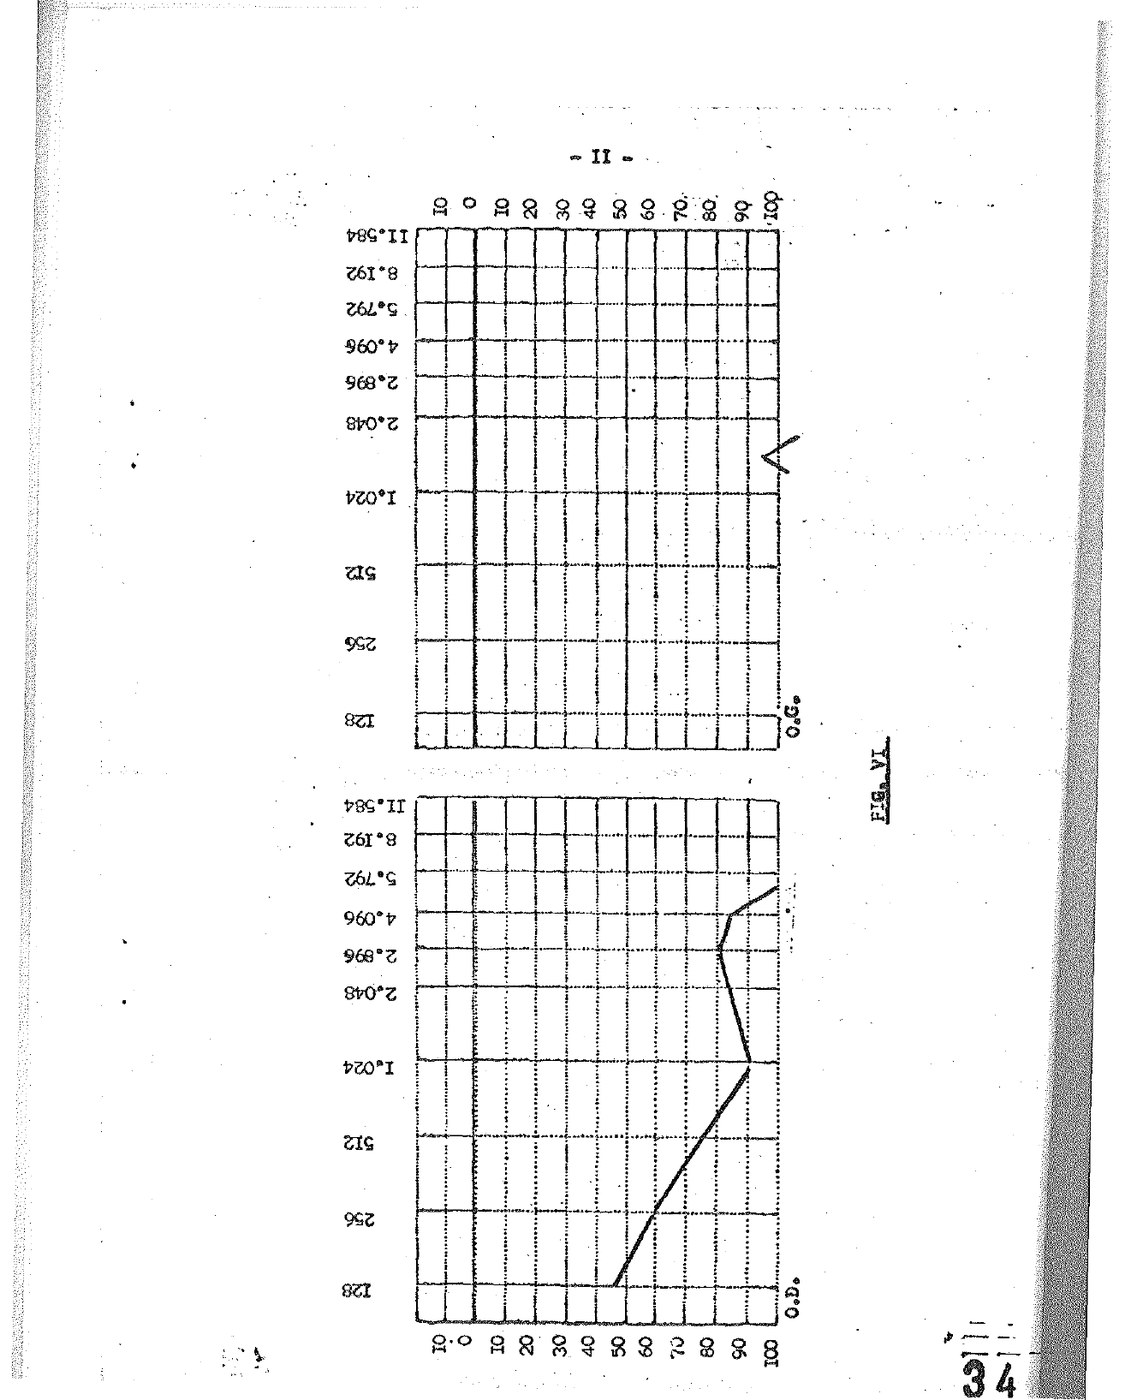
4°) Audiogram of a professor of Letters, a music-lover, afflicted with a deafness contracted in captivity: he has retained the love of music but can no longer reproduce it — what we have called an “expressive amusia” (Fig. 6).
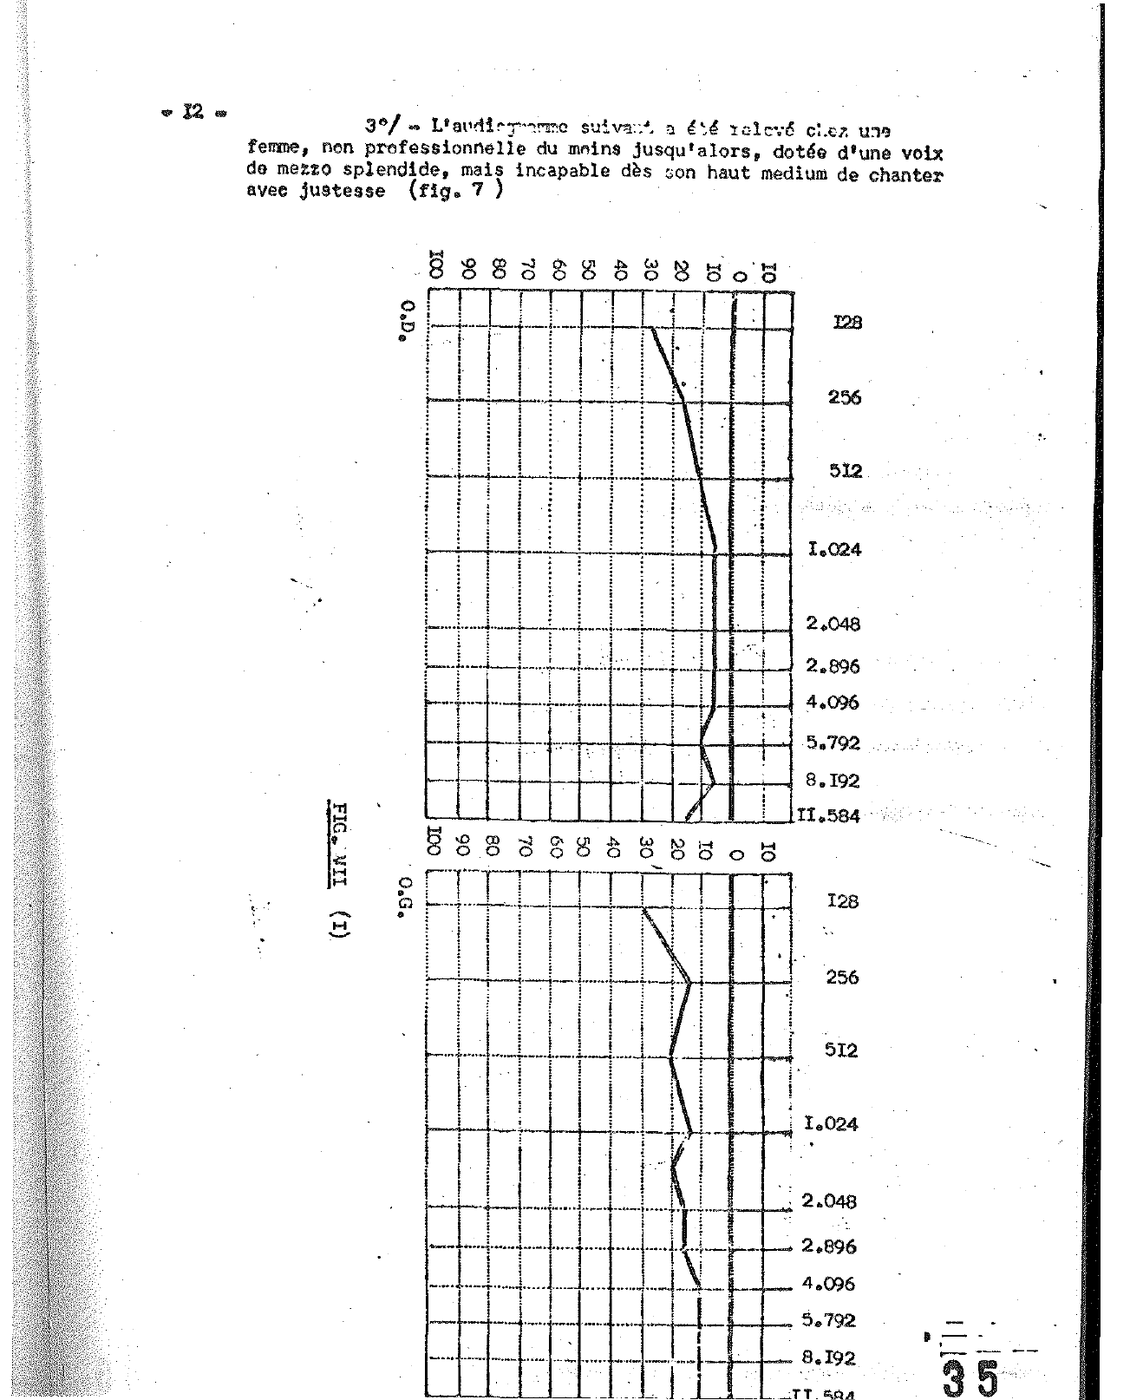
5°) Audiogram of a woman, a mezzo-soprano of splendid timbre, incapable of singing in tune in the upper middle register (Fig. 7). Examined in March 1952 and placed under treatment, by July 1952 she presented a progressive regression of the auditory deficit on the right ear, and her vocal timbres recovered their amplitude.
VII. — The “reserve potential” and its impairment
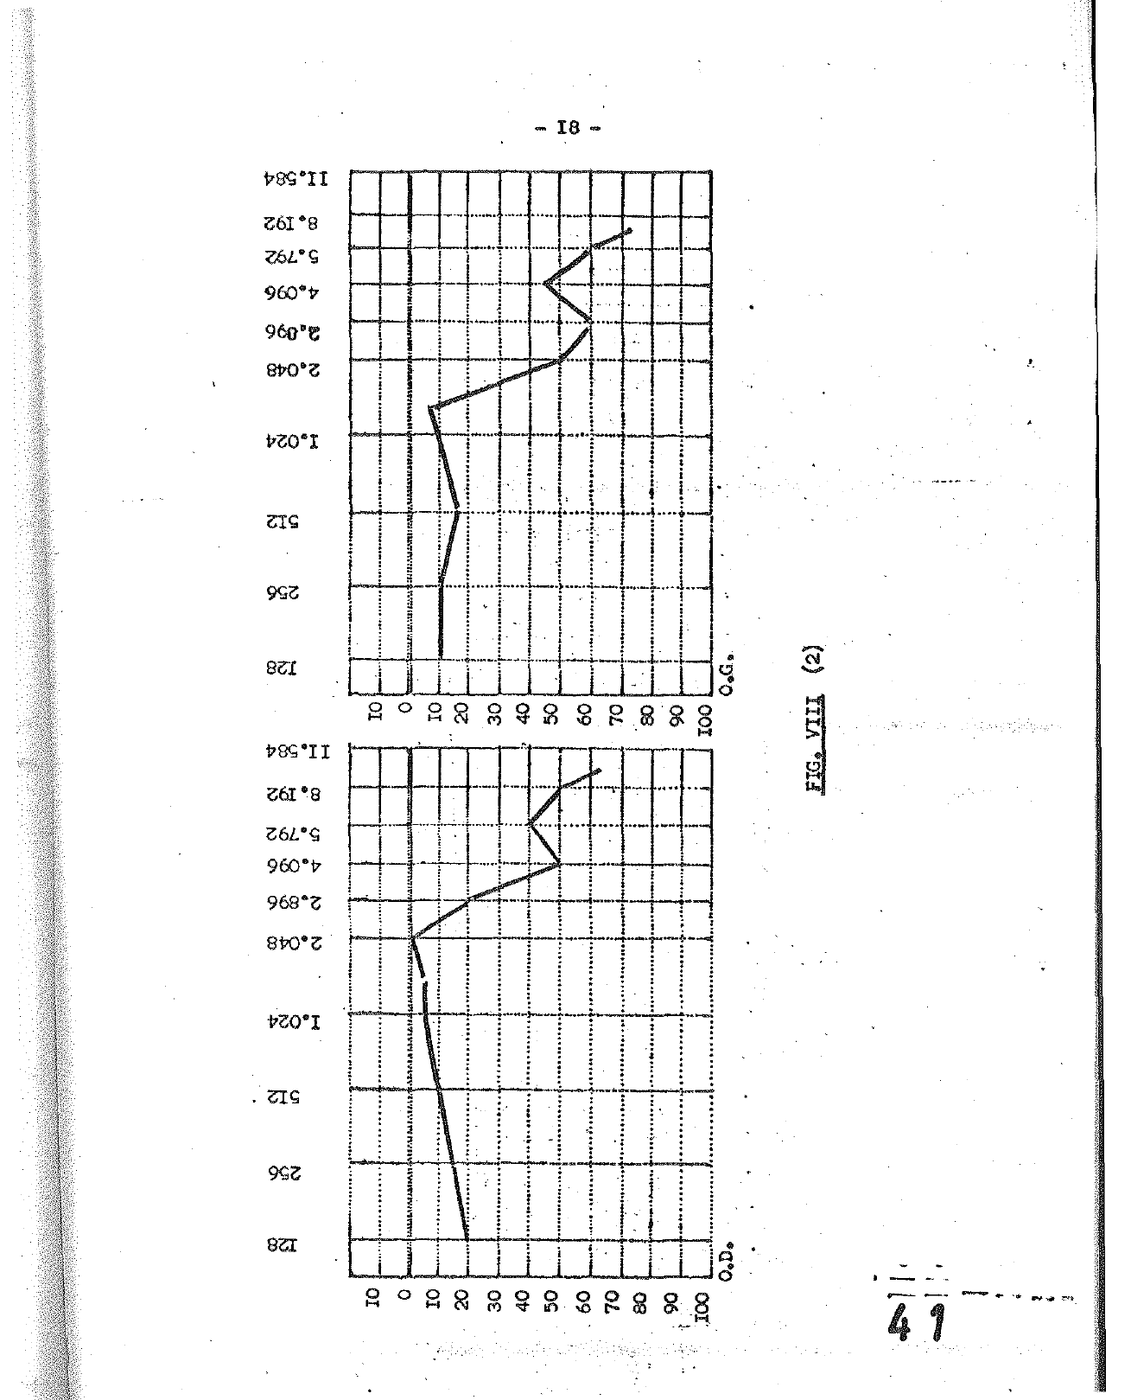
6°) In Fig. 8, two singers of great power whose “reserve potentials” in the 2,000 c/s zone are compromised by the prolonged use of the voice.
7°) Several established facts deserve to be emphasised:
a) When an artist listens simultaneously with both ears, or with the right ear alone, nothing changes; but when listening with the left ear alone, his voice suddenly becomes flat, monotone, without quality or musicality.
b) An over-audition of 10 to 20 dB by means of a peak amplification in the 1,500 — 2,000 c/s zone immediately rectifies the voice.
c) Auditory fatigue bears electively on the 1,000 — 2,000 c/s zone, and it is in this zone that the fate of the singing voice is played out.
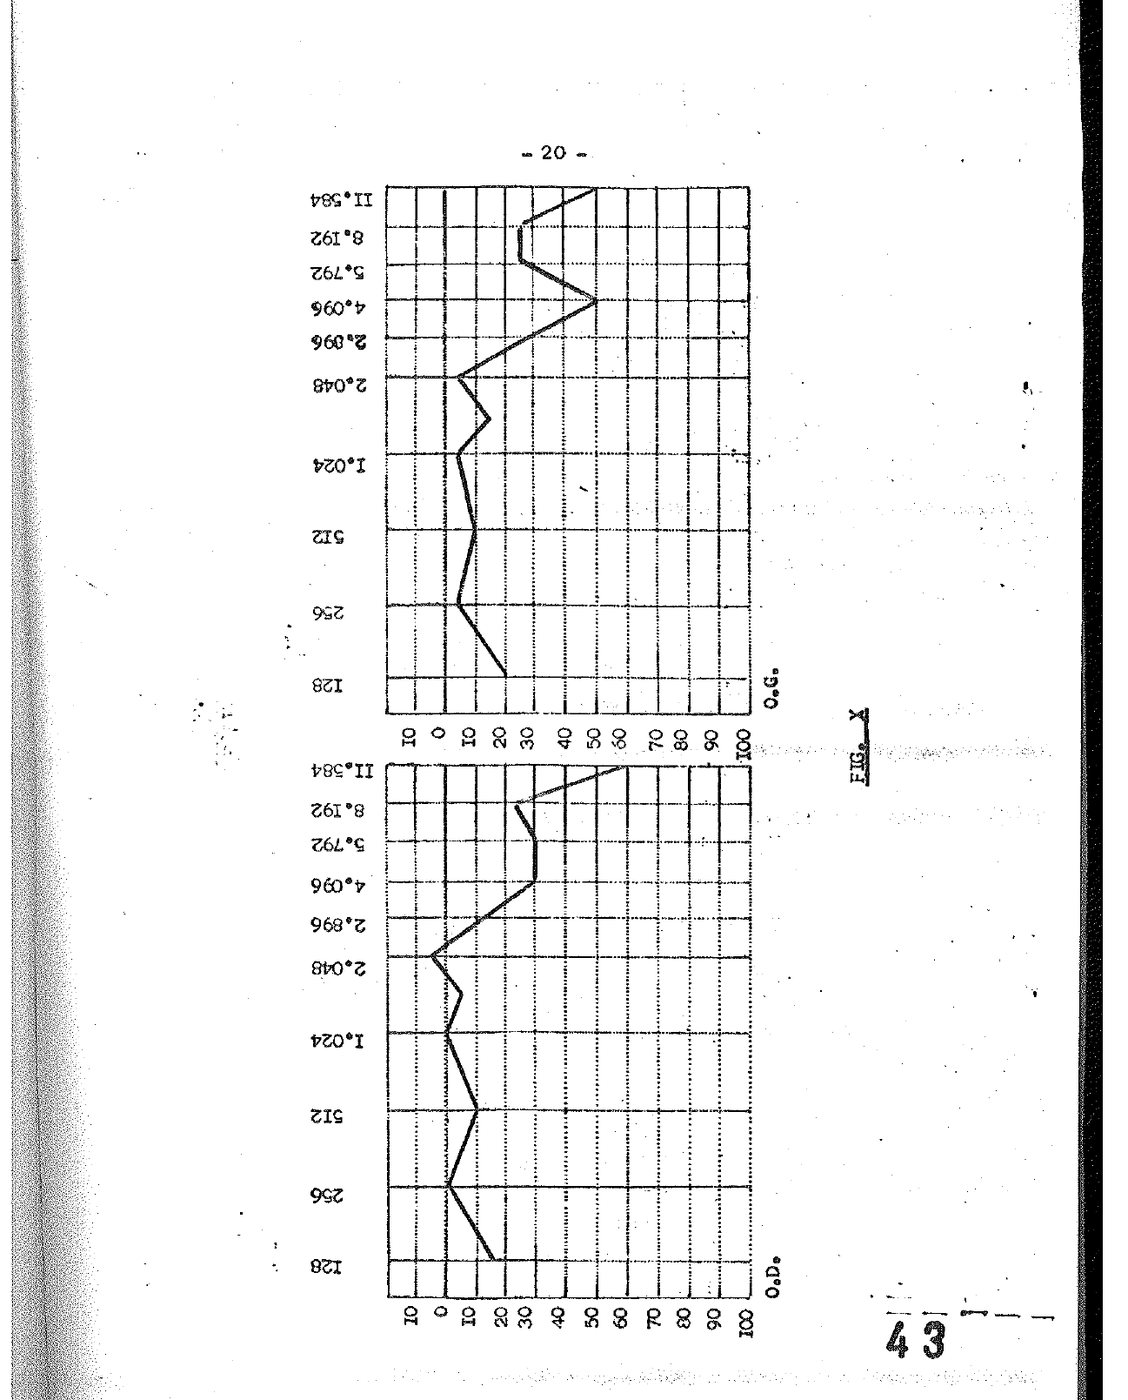
Fig. 9 shows the tracing of a professional bass singer, whose curves change in two minutes of sonic dazzlement. Fig. 10 illustrates the reduction of the reserve potential. Any reduction of this potential is reflected in vocal disorders, and the auditory lesions thus observed are analogous to those presented by workers exposed to industrial noise.
VIII. — Four stages of occupational deafness
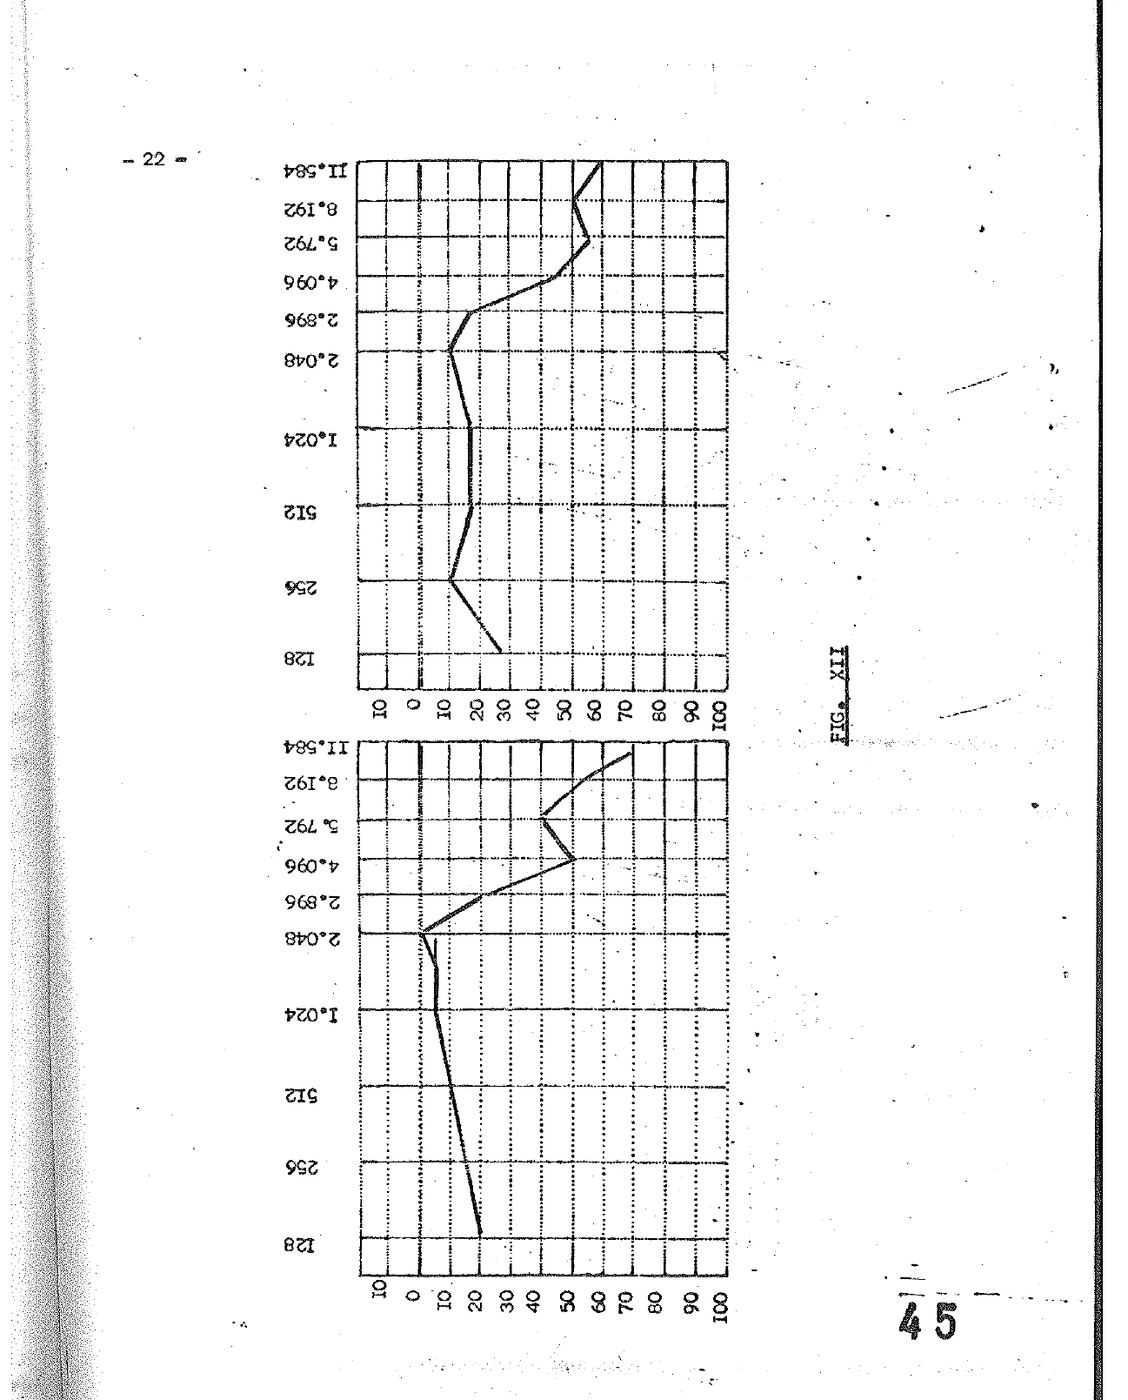
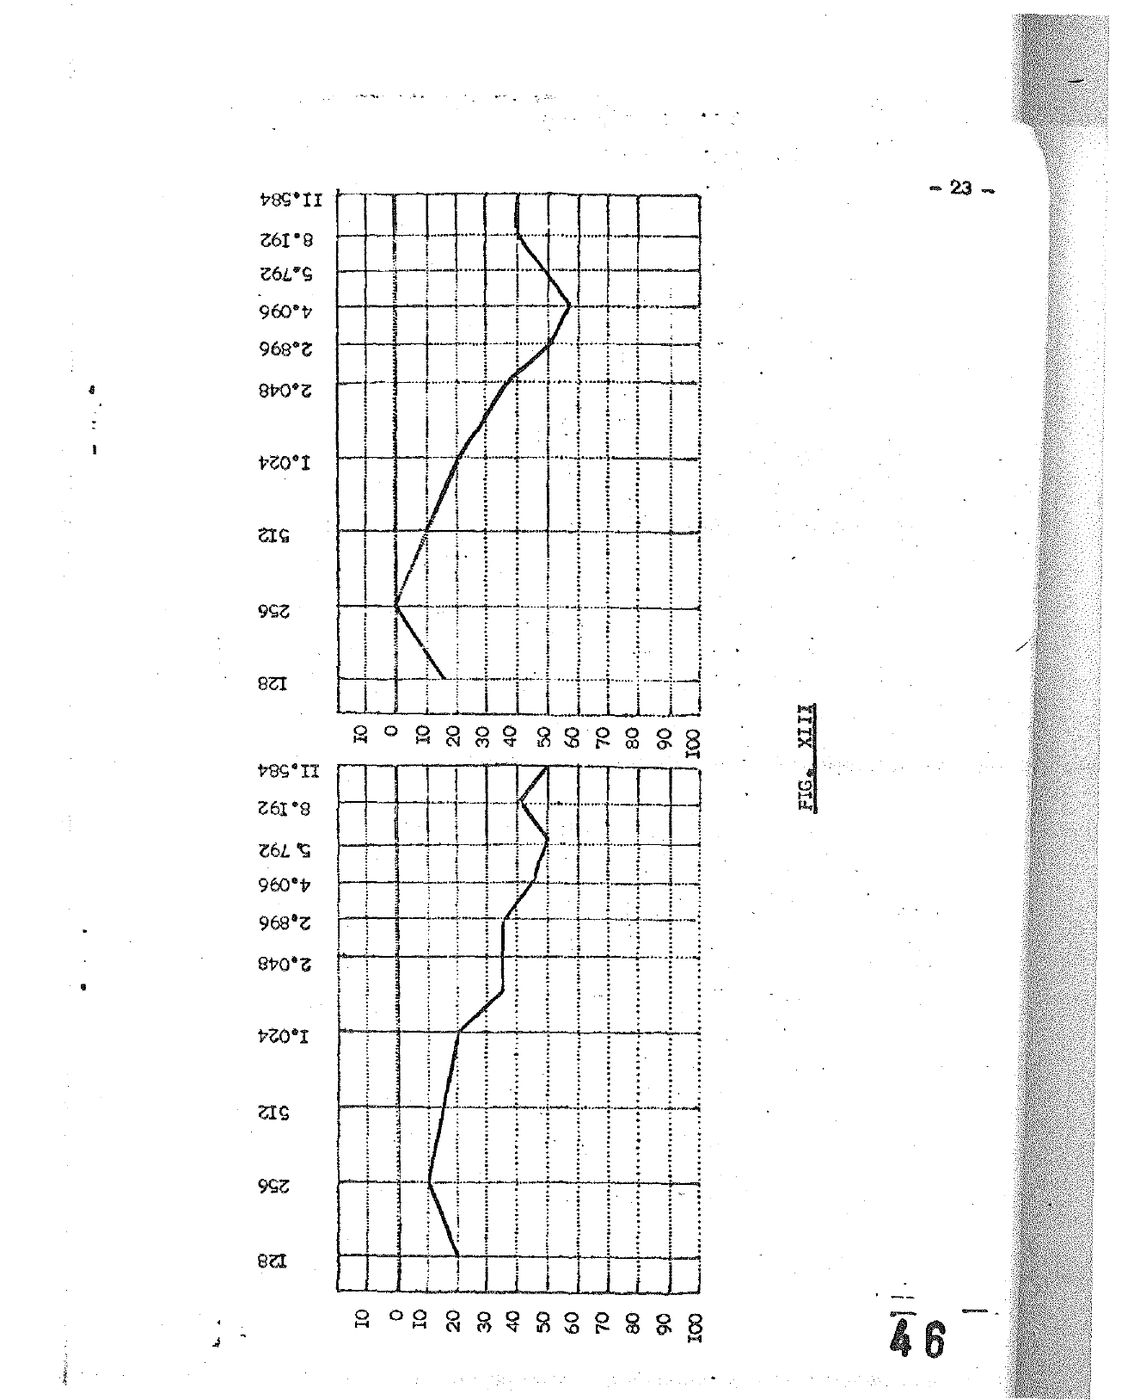
The juxtaposition is striking. The first of the two singers studied was an artist of great renown, exposed to his own voice for 25 years; the second, an aircraft adjuster, exposed to noise for 25 years likewise. Figs. 11 to 14 place side by side, on the left the audiograms of four factory workers, on the right those of four singers: these eight tracings illustrate the four evolutionary stages of one and the same occupational deafness, whether contracted on the test bench or on the operatic stage.
The ear of the singer and the ear of the factory worker thus belong to a common physiology: it is the reserve potential, in the 1,500 — 2,000 c/s zone, which determines both the capacity to reproduce the musical phrase and the resistance to sonic aggression.
IX. — Iconography
-
Fig. I — Audiometric profile characteristic of the musical ear: ascending curve from the low to the high frequencies, difference in level of 10—20 dB between 500 and 2,000 c/s.
-
Fig. II — Audiometric profiles of a worker exposed for 4 years and of a subject exposed for 21 years: “musical ear” signature intact despite exposure.
-
Fig. III — Audiograms of the two professional singers seen in consultation: inflexion above 1,000 c/s explaining the impossibility of singing in tune.
-
Fig. IV — Inversion of auditory dominance in the left-handed subject.
-
Fig. V — Woman, formerly a concert pianist, incapable of “departing” from musical audition.
-
Fig. VI — Music-loving professor of Letters, “expressive amusia” following a deafness contracted in captivity.
-
Fig. VII — Mezzo-soprano of splendid timbre: audiogram at examination, and progressive regression under treatment between March and July 1952.
-
Fig. VIII — Two singers of great power whose reserve potentials at 2,000 c/s are compromised.
-
Fig. IX — Professional bass singer: shift of the threshold after two minutes of sonic dazzlement.
-
Fig. X — Diagram of the reduction of reserve potential.
-
Figs. XI to XIV — Comparative tables: on the left, four factory workers; on the right, four singers. The four evolutionary stages of one and the same occupational deafness.
Source: Tomatis A., “L’oreille musicale”, communication presented at the 12th Congress of the Société Française de Phoniatrie (Paris, 15 October 1952), Journal Français d’Oto-Rhino-Laryngologie, no. 2, February 1953. Work carried out at the Research Laboratory of the Arsenal de l’Aéronautique. See also: “Incidences observées dans les lésions auriculaires constatées chez le personnel des bancs d’essais et les professionnels de la voix”, Bulletin d’Information, October 1952. Digitised document from Alfred Tomatis’s personal archives.
Illustrated pages from the original document
Pages of the PDF facsimile containing figures, diagrams or audiograms. Depending on the original layout, certain pages may appear in landscape orientation.
Page 3 of the facsimile
Page 4 of the facsimile
Page 5 of the facsimile
Page 9 of the facsimile
Page 11 of the facsimile
Page 12 of the facsimile
Page 16 of the facsimile
Page 18 of the facsimile
Page 20 of the facsimile
Page 22 of the facsimile
Page 23 of the facsimile